If you already use Home Assistant, using the InfluxDB integration, coupled with Grafana will allow you to create very useful data visualizations that offers insight into your home over time. This includes things like: what are the humidity level fluctuations? What is the temperature indoors compared to outdoors? And much more ...
The Problem: Home Assistant Climate Integration
One question that took me many months of searching, is how to make a graph for the thermostat/HVAC, in order to see how long heating or cooling is running, versus indoor temperature and various other data points. The reason this is hard is that the thermostat uses the Climate integration in Home Assistant, which actually combines lots of data points into a single one entity, and making those data points attributes. As a result, it is not obvious how to get the data into InfluxDB. The Home Assistant forums have several questions on the topic that are either unanswered or involve convoluted partial solutions, such as using template sensors (example 1, example 2).
The rest of this article outlines how to solve the above problem, and get everything from Home Assistant to InfluxDB/Grafana.
Configure InfluxDB in Home Assistant
A minimal InfluxDB configuration in Home Assistant would not send an entity's attributes, or convert an entity into an InfluxDB measurement automatically.
To get over this limitation, you need to add the last four lines from the configuration snippet below:
influxdb:
  host: 127.0.0.1
  max_retries: 3
  tags_attributes:
    - entity_id
    - friendly_name
    - device_class
What this does is have each entity as a measurement and put the attributes as fields in there.
Side note: While you are at it, add the following, in order to get InfluxDB to better compress historical data:
precision: msOnce you add the above, and restart Home Assistant, you should be able to have queries like the ones below.
Create The Grafana Queries
Now you need to know what your thermostat entity name in Home Assistant, for example "climate.my_thermostat".
The following will show what desired temperature you have set the thermostat to.
SELECT last("temperature")
FROM "climate.my_thermostat"
WHERE $timeFilter
GROUP BY time($__interval)
fill(previous)
And the following will show what actual temperature the thermostat is measuring from your indoor air.
SELECT last("current_temperature")
FROM "climate.my_thermostat"
WHERE $timeFilter
GROUP BY time($__interval)
fill(previous)
And finally, you can create a graph of how long the thermostat is heating or cooling, per the following query.
Since the value for the hvac_action in Home Assistant is a string, the graph has to be a State Timeline in Grafana.
And while you are there, you may want to use the Value mapping option to assign colours to the various values (off, heating, cooling).
SELECT last("hvac_action_str")
FROM "climate.my_thermostat"
WHERE $timeFilter
GROUP BY time($__interval)
fill(previous)
The Result: Everything Visualized
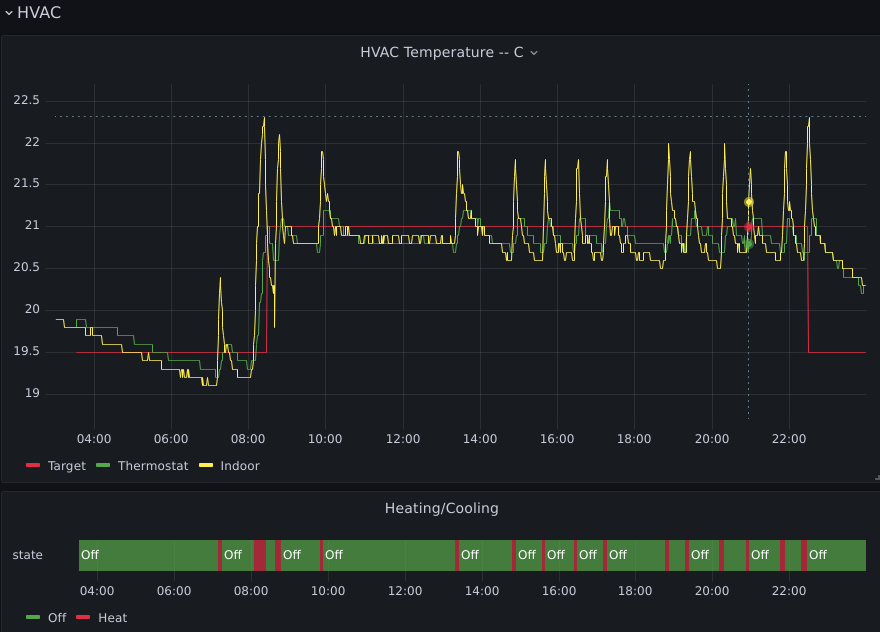
When you have completed all of the above steps, you can now see a graph like this one:

Acknowledgements
Thanks to Andrew Berry for his advice on the tag_attributes setting in Home Assistant YAML. Without this advice, this article would not have been possible.

Comments
garrett (not verified)
not working for me
Mon, 2023/08/28 - 17:30I modified my influxdb configuration in configuration.yaml with the tags_attributes setting as prescribed.
My climate entity as shown by hass-cli:
I still cannot access those values from grafana or influxdb command line.
or
Nothing shows up.
Khalid
Differences ...
Mon, 2023/08/28 - 18:00One thing that is different in my case is that I don't have this line for influxDB:
As for values, this is the query that returns values to Grafana:
Returns this:
garrett (not verified)
Thank you
Wed, 2023/08/30 - 09:39Thanks for your response. That was it. I removed the default_measurement line from my configuration.yaml file and my queries work as you indicated. Now I just need to get the status visualization and temperature graph overlaid somehow so that the times line-up. My two graphs are a little "off". I really appreciate you sharing, though. I've been trying to get this status view worked out for a long time.
Urban Olsson (not verified)
Thanks!
Wed, 2023/12/27 - 14:38Exactly what I was looking for. Couldn't have done it on my own